Table of Contents
Haproxy를 사용한 시스템을 운영중인데, 여기에서 확인할 수 있는 다양한 상태값을 모니터링 해보고 싶었다. 간단하게는 Haproxy가 살아 있는지에서 부터 현재 연결된 커넥션 갯수를 확인하는 것 까지 작업을 수행해보았다.
Haproxy 의 statistics 를 얻을 수 있는 방법
Haproxy 의 statistics를 확인할 수 있는 방법은 다음의 2가지 방법을 확인가능하다.
1. HTTP 상에서 확인할 수 있는 방법
haproxy.cfg 에 다음과 같이 stats 설정을 지정하면 http 를 통해서 확인이 가능하다
listen stats # "stats"라는 이름으로 listen 지정
    bind :9000 # 접속 포트 지정
    stats enable
    stats realm Haproxy\ Statistics  # 브라우저 타이틀
    stats uri /haproxy_stats  # stat 를 제공할 URI
    stats auth Username:Password # 인증이 필요하면 추가한다
이렇게 설정한 뒤에 http://haproxy_host:9000 으로 접속하면 다음과 같은 화면을 확인할 수 있다.
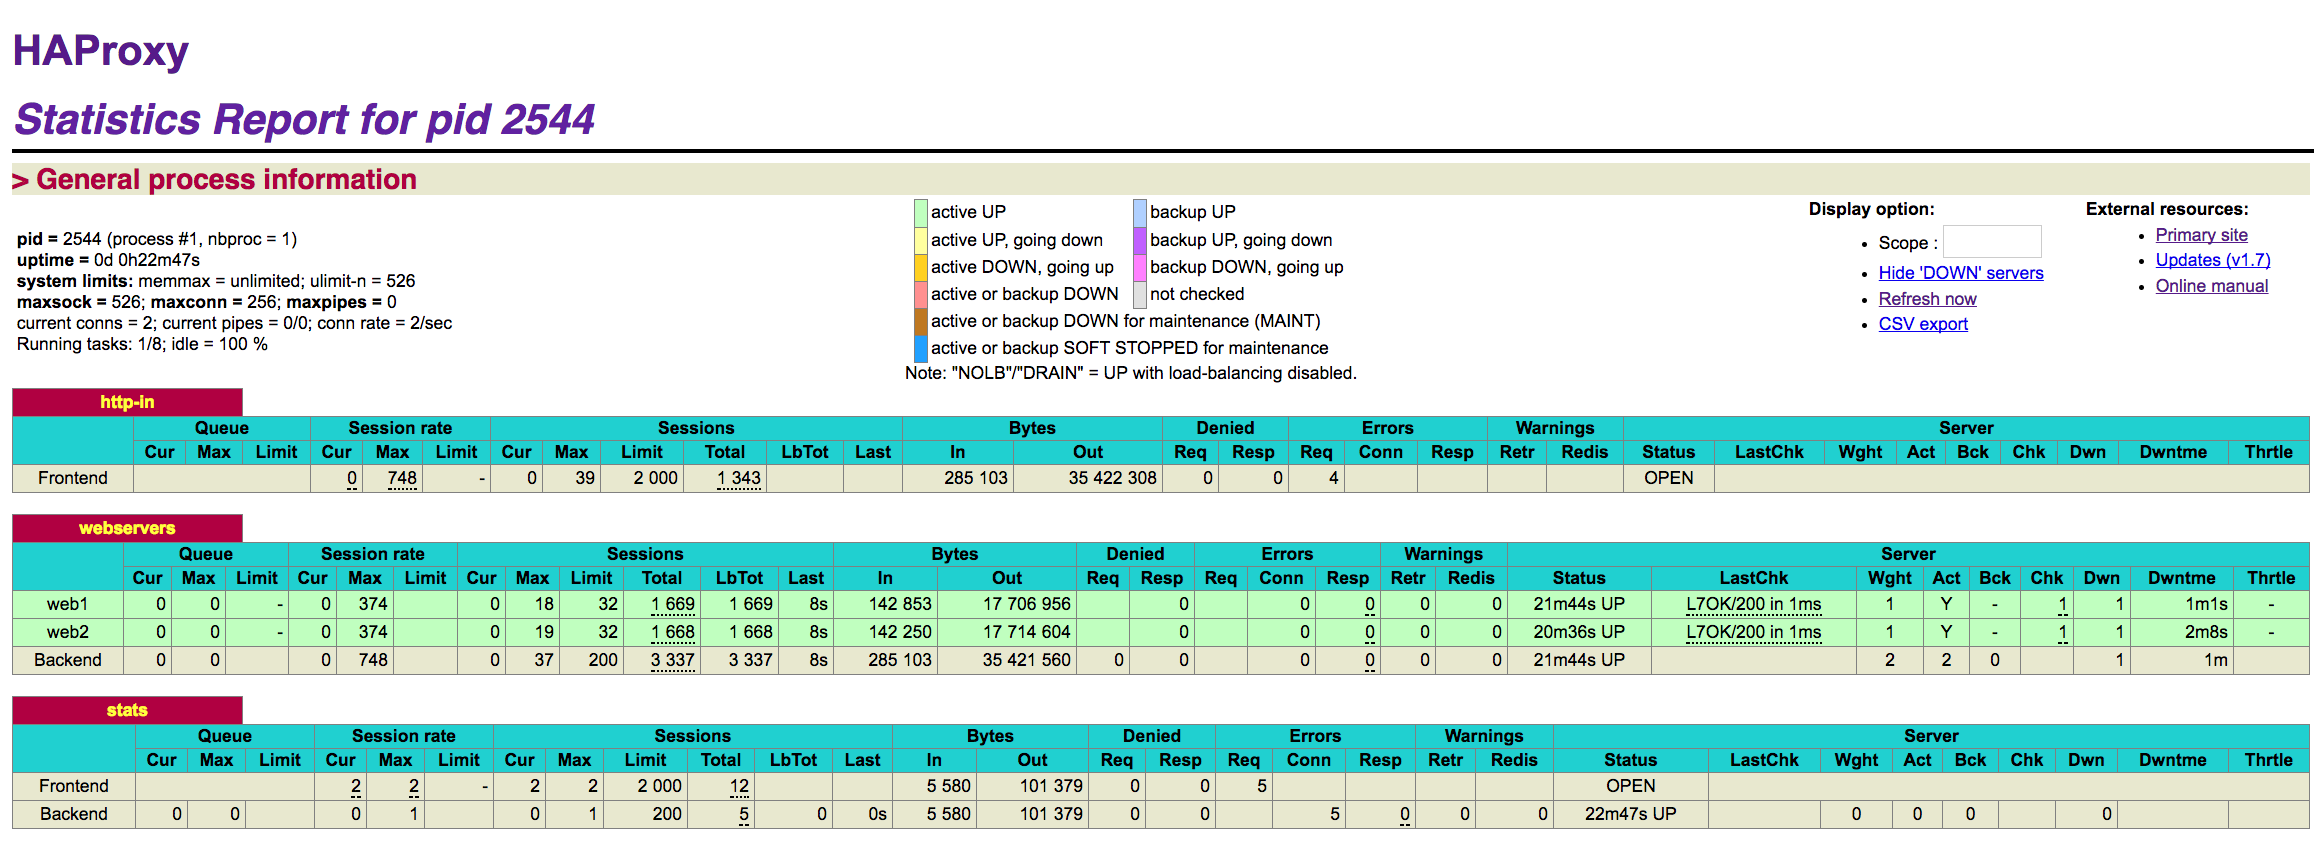
화면으로만 보는 것도 의미가 있지만 모니터링을 위해서는 metric 정보만 필요할 수도 있다. 주로 CSV 포맷으로 보게 되는데 URI 뒤에 ;csv를 붙이면 된다.
위와 같은 설정이라면 stats URI 를 /haproxy_stats;csv 라고 접근하면 된다.
2. unix socket 를 사용하는 방법
http 를 사용할 수도 있지만 unix socket 을 사용할 수도 있다. 먼저 haproxy.cfg 에 다음과 같이 설정되어 있어야 한다.
stats socket /var/run/haproxy.sock
그리고 socat 명령어를 사용할 수 있어야 한다. 명령어가 설치되어 있지 않다면 yum 또는 apt 를 사용해서 설치해야한다.
이제 다음 명령어로 stat 을 확인할 수 있다.
echo "show stat" | socat unix-connect:/var/run/haproxy.sock stdio


http-in,FRONTEND,,,0,85,2000,4655,380562,991165,0,0,14,,,,,OPEN,,,,,,,,,1,2,0,,,,0,0,0,3305,,,,0,0,0,14,4641,0,,0,3305,4655,,,0,0,0,0,,,,,,,,
appname,lamp1,0,0,0,0,,0,0,0,,0,,0,0,0,0,DOWN,1,1,0,1,1,134,134,,1,3,1,,0,,2,0,,0,L4TOUT,,2002,0,0,0,0,0,0,0,,,,0,0,,,,,-1,,,0,0,0,0,
appname,lamp2,0,0,0,0,,0,0,0,,0,,0,0,0,0,DOWN,1,1,0,1,1,133,133,,1,3,2,,0,,2,0,,0,L4TOUT,,2002,0,0,0,0,0,0,0,,,,0,0,,,,,-1,,,0,0,0,0,
appname,BACKEND,0,0,0,77,200,4641,380562,988533,0,0,,4641,0,0,0,DOWN,0,0,0,,1,133,133,,1,3,0,,0,,1,0,,3292,,,,0,0,0,0,4641,0,,,,,0,0,0,0,0,0,-1,,,0,0,0,0,
여기서 출력되는 정보는 haproxy.cfg 에 설정된 backend, frontend 에 따라서 조금씩 달라진다. 그리고 여기서 확인되는 정보는 다음과 같다.
  0. pxname [LFBS]: proxy name
  1. svname [LFBS]: service name (FRONTEND for frontend, BACKEND for backend,
     any name for server/listener)
  2. qcur [..BS]: current queued requests. For the backend this reports the
     number queued without a server assigned.
  3. qmax [..BS]: max value of qcur
  4. scur [LFBS]: current sessions
  5. smax [LFBS]: max sessions
  6. slim [LFBS]: configured session limit
  7. stot [LFBS]: cumulative number of connections
  8. bin [LFBS]: bytes in
  9. bout [LFBS]: bytes out
 10. dreq [LFB.]: requests denied because of security concerns.
     - For tcp this is because of a matched tcp-request content rule.
     - For http this is because of a matched http-request or tarpit rule.
 11. dresp [LFBS]: responses denied because of security concerns.
     - For http this is because of a matched http-request rule, or
       "option checkcache".
 12. ereq [LF..]: request errors. Some of the possible causes are:
     - early termination from the client, before the request has been sent.
     - read error from the client
     - client timeout
     - client closed connection
     - various bad requests from the client.
     - request was tarpitted.
 13. econ [..BS]: number of requests that encountered an error trying to
     connect to a backend server. The backend stat is the sum of the stat
     for all servers of that backend, plus any connection errors not
     associated with a particular server (such as the backend having no
     active servers).
 14. eresp [..BS]: response errors. srv_abrt will be counted here also.
     Some other errors are:
     - write error on the client socket (won't be counted for the server stat)
     - failure applying filters to the response.
 15. wretr [..BS]: number of times a connection to a server was retried.
 16. wredis [..BS]: number of times a request was redispatched to another
     server. The server value counts the number of times that server was
     switched away from.
 17. status [LFBS]: status (UP/DOWN/NOLB/MAINT/MAINT(via)...)
 18. weight [..BS]: total weight (backend), server weight (server)
 19. act [..BS]: number of active servers (backend), server is active (server)
 20. bck [..BS]: number of backup servers (backend), server is backup (server)
 21. chkfail [...S]: number of failed checks. (Only counts checks failed when
     the server is up.)
 22. chkdown [..BS]: number of UP->DOWN transitions. The backend counter counts
     transitions to the whole backend being down, rather than the sum of the
     counters for each server.
 23. lastchg [..BS]: number of seconds since the last UP<->DOWN transition
 24. downtime [..BS]: total downtime (in seconds). The value for the backend
     is the downtime for the whole backend, not the sum of the server downtime.
 25. qlimit [...S]: configured maxqueue for the server, or nothing in the
     value is 0 (default, meaning no limit)
 26. pid [LFBS]: process id (0 for first instance, 1 for second, ...)
 27. iid [LFBS]: unique proxy id
 28. sid [L..S]: server id (unique inside a proxy)
 29. throttle [...S]: current throttle percentage for the server, when
     slowstart is active, or no value if not in slowstart.
 30. lbtot [..BS]: total number of times a server was selected, either for new
     sessions, or when re-dispatching. The server counter is the number
     of times that server was selected.
 31. tracked [...S]: id of proxy/server if tracking is enabled.
 32. type [LFBS]: (0=frontend, 1=backend, 2=server, 3=socket/listener)
 33. rate [.FBS]: number of sessions per second over last elapsed second
 34. rate_lim [.F..]: configured limit on new sessions per second
 35. rate_max [.FBS]: max number of new sessions per second
 36. check_status [...S]: status of last health check, one of:
        UNK     -> unknown
        INI     -> initializing
        SOCKERR -> socket error
        L4OK    -> check passed on layer 4, no upper layers testing enabled
        L4TOUT  -> layer 1-4 timeout
        L4CON   -> layer 1-4 connection problem, for example
                   "Connection refused" (tcp rst) or "No route to host" (icmp)
        L6OK    -> check passed on layer 6
        L6TOUT  -> layer 6 (SSL) timeout
        L6RSP   -> layer 6 invalid response - protocol error
        L7OK    -> check passed on layer 7
        L7OKC   -> check conditionally passed on layer 7, for example 404 with
                   disable-on-404
        L7TOUT  -> layer 7 (HTTP/SMTP) timeout
        L7RSP   -> layer 7 invalid response - protocol error
        L7STS   -> layer 7 response error, for example HTTP 5xx
 37. check_code [...S]: layer5-7 code, if available
 38. check_duration [...S]: time in ms took to finish last health check
 39. hrsp_1xx [.FBS]: http responses with 1xx code
 40. hrsp_2xx [.FBS]: http responses with 2xx code
 41. hrsp_3xx [.FBS]: http responses with 3xx code
 42. hrsp_4xx [.FBS]: http responses with 4xx code
 43. hrsp_5xx [.FBS]: http responses with 5xx code
 44. hrsp_other [.FBS]: http responses with other codes (protocol error)
 45. hanafail [...S]: failed health checks details
 46. req_rate [.F..]: HTTP requests per second over last elapsed second
 47. req_rate_max [.F..]: max number of HTTP requests per second observed
 48. req_tot [.F..]: total number of HTTP requests received
 49. cli_abrt [..BS]: number of data transfers aborted by the client
 50. srv_abrt [..BS]: number of data transfers aborted by the server
     (inc. in eresp)
 51. comp_in [.FB.]: number of HTTP response bytes fed to the compressor
 52. comp_out [.FB.]: number of HTTP response bytes emitted by the compressor
 53. comp_byp [.FB.]: number of bytes that bypassed the HTTP compressor
     (CPU/BW limit)
 54. comp_rsp [.FB.]: number of HTTP responses that were compressed
 55. lastsess [..BS]: number of seconds since last session assigned to
     server/backend
 56. last_chk [...S]: last health check contents or textual error
 57. last_agt [...S]: last agent check contents or textual error
 58. qtime [..BS]: the average queue time in ms over the 1024 last requests
 59. ctime [..BS]: the average connect time in ms over the 1024 last requests
 60. rtime [..BS]: the average response time in ms over the 1024 last requests
     (0 for TCP)
 61. ttime [..BS]: the average total session time in ms over the 1024 last
     requests
이제 stat 를 확인하는 스크립트를 구성한다. www라는 frontend 의 scur(current sessions)를 출력하는 스크립트로 구성했다.
#!/bin/sh

sock='/var/run/haproxy.sock'
host="$(hostname -f)"
pause=1


time="$(date +%s)"
echo 'show stat' | socat - UNIX-CLIENT:$sock \
  |while IFS=',' read pxname svname qcur qmax scur smax slim stot bin bout dreq dresp ereq econ eresp wretr wredis status weight act bck chkfail chkdown lastchg downtime qlimit pid iid sid throttle lbtot tracked type rate rate_lim rate_max check_status check_code check_duration hrsp_1xx hrsp_2xx hrsp_3xx hrsp_4xx hrsp_5xx hrsp_other hanafail req_rate req_rate_max req_tot cli_abrt srv_abrt comp_in comp_out comp_byp comp_rsp; do
  if [ "$svname" = 'FRONTEND' ]; then
    if [ "$pxname" = 'www' ]; then
      name=$(echo $svname | tr '[:upper:]' '[:lower:]')
      echo "${scur:-0}"
    fi
  fi
done
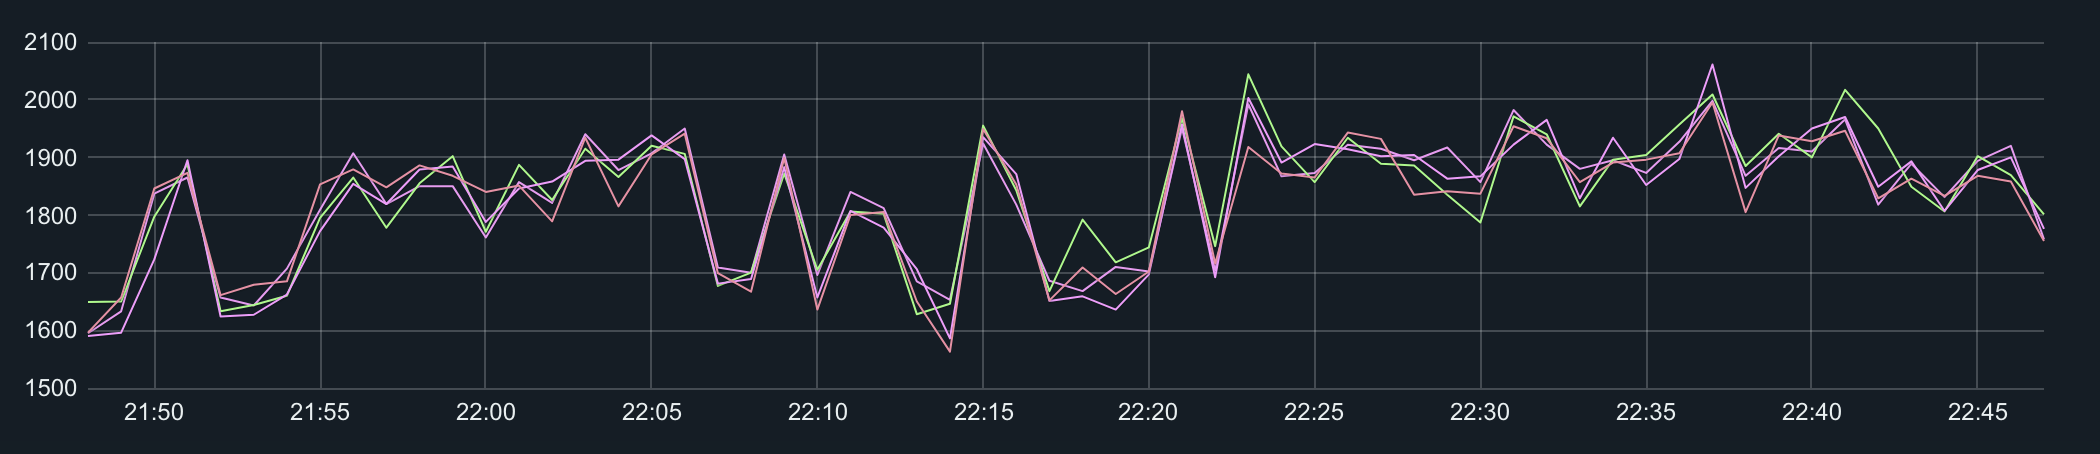
이 결과를 이제 collectd 에 연결해서 그래프로 그리면 된다.
LoadPlugin "exec"
<Plugin "exec">
    Exec "haproxy:haproxy" "/usr/local/bin/haproxy-stats"

</Plugin>
두가지 방법중에 나의 경우는 unix socket 을 사용했다.
요약
haproxy 의 stat를 확인하여 모니터링하는 방법은 unix socket 을 활용해서 필요한 정보(여기서는 current session)를 얻는 스크립트를 작성하고 이를 주기적으로 실행해서
(collectd 또는 별도의 방법을 사용해도 된다.) 수집된 데이터를 전달하여 그래프로 그리는 것이다.
그래프는 grafana 같은 그래프로 연결해 놓으면 보기도 편하고 이상이 있을 때 알림을 걸 수도 있어서 편리하다.
참고
- stat 수집 획득하는 방법 : https://www.datadoghq.com/blog/how-to-collect-haproxy-metrics/
- stat haproxy 매뉴얼 : https://cbonte.github.io/haproxy-dconv/1.8/management.html#9
- socket 으로 haproxy stat 획득하기 : https://makandracards.com/makandra/36727-get-haproxy-stats-informations-via-socat
- stat 수집 script : https://gist.github.com/bpaquet/7153979
- stat 설명 : https://gist.github.com/alq666/20a464665a1086de0c9ddf1754a9b7fb
comments powered by Disqus