Table of Contents
Elasticsearch의 버전업을 지원하기 위해서 logstash 와 filebeat를 새롭게 설치하고 설정해보았다. 진행한 작업 내용을 정리 해보았다.
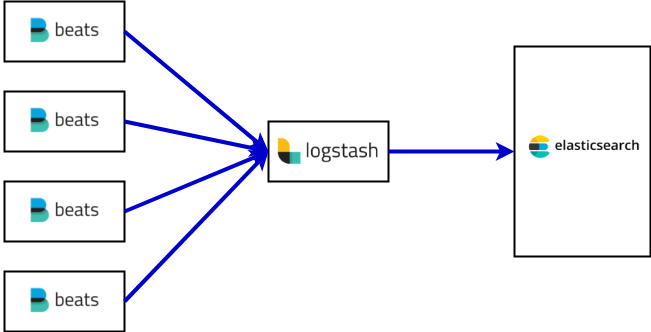
서버 구성
먼저 서버 구성은 다음과 같다.
- ElasticSearch 클러스터가 별도로 존재
- LogStash 1대
- 다수의 웹서버에 각각 Filebeat 를 설치.
filebeat
filebeat 설치
-
filebeat 를 yum을 통해서 설치
sudo rpm --import https://packages.elastic.co/GPG-KEY-elasticsearch -
/etc/yum.repods.d/elastic.repo 추가
[elastic-6.x] name=Elastic repository for 6.x packages baseurl=https://artifacts.elastic.co/packages/6.x/yum gpgcheck=1 gpgkey=https://artifacts.elastic.co/GPG-KEY-elasticsearch enabled=1 autorefresh=1 type=rpm-md -
yum 을 통해서 설치
yum install filebeat
filebeat 설정
filebeat 에서는 json 형태로 logstash 에게 데이터를 전달하고, 이때 message 필드에 수집한 로그 파일의 데이터가 담겨진다.
수집하려는 log file 의 유형에 따라서 community beats를 사용할 수도 있지만,
나의 경우에는 Custom pattern의 로그 파일을 수집할 예정이라 logstash에서 pasring 하는 형태를 선택했다. (직접 beat를 만들 수도 있다.링크, 언어는 golang.)
/etc/filebeat/filebeat.yml파일 변경
filebeat.prospectors:

# Each - is a prospector. Most options can be set at the prospector level, so
# you can use different prospectors for various configurations.
# Below are the prospector specific configurations.

- type: log
  enabled: true
  paths:
    - /var/log/my_log_path/*.log
  fields:
    index_name: "my_custom_file_index_name"

#----------Elasticsearch output--------------- 주석처리
# (beats 에서 바로 ES 로 데이터 전달하지 않음)


#----------Logstash output ------------------- 주석해제
# (beats 에서 logstash 로 데이터 전달)

output.logstash:
  # The Logstash hosts
  hosts: ["my-logstash-server-host:5044"]

...
- 수집할 log를 정의하고
fields를 추가하였다. 추가한fields는 logstash에 변수로 전달된다. 필요한 경우 여러개를 추가 할 수 있다.
filebeat 실행
service filebeat start
filebeat 데몬 로그 확인
tail -f /var/log/filebeat/filebeat
filebeat 에서 file 을 다시 읽어 들어야 하는 경우
-
filebeat 는 파일을 어디까지 읽어 들였는지 메타 정보를
/var/lib/filebeat/registry파일에 기록하고 있다. -
따라서 이 메타 정보를 강제로 reset 하려면 다음과 같이 하면 된다. (경험적으로 설치가 잘 되었는지 확인될 때까지는 메타 정보를 여러번 reset 해야했다.)
echo "[]" > /var/lib/filebeat/registry
logstash
logstash 설치
- logstash 는 Java 가 준비된 환경에서 Download Link에서 다운받아서 설치했다.
logstash plugin 설치
- 사용할 필터중에서 bundle 로 제공되지 않는 alter 설치
bin/logstash-plugin install logstash-filter-alter
Validating logstash-filter-alter
Installing logstash-filter-alter
Installation successful
logstash 에 filter 설정
-
grok, mutate, json, geoip, alter 필터를 설정했고 filebeat 에서 fields 로 넘겨받은 index_name을 사용했다.
-
date 필터는 기준 시각을 filebeat 에 의해서 파싱된 시각을 사용하지 않고, log 에 기록된 시각으로 지정하도록 한다.
input {
  beats {
    port => "5044"
  }
}
filter {
  grok {
    match => { "message" => "%{TIMESTAMP_ISO8601:time}\t%{DATA:tag}\t{ % {DATA:data} }" }
  }
  mutate {
    add_field => { "json_data" => "{ %{data}}" }
  }
  json {
    source => "json_data"
  }
  if [fields][index_name] == "qna5" {
    geoip {
      source => "remote_addr"
    }
  }
  alter {
      remove_field => [ "data", "json_data" ]
  }
  date {
    match => [ "time", "yyyy-MM-dd'T'HH:mm:ssZZ" ]
  }
}
output {
  elasticsearch {
    hosts => "my-elastcisearch-server-host:9200"
    index => "%{[fields][index_name]}-%{+YYYY.MM.dd}"
    document_type => "%{[fields][index_name]}"
  }
}
# debug 를 위해서는 아래의 출력으로 조정.
#output {
#  stdout { codec => json }
#}
logstash 실행
nohup logstash/bin/logstash -f logstash.conf > /var/log/logstash/logstash.out
elasticsearch 확인
- 인덱스와 데이터가 제대로 들어오는지 확인하면 된다.
참고
- https://www.elastic.co/guide/en/beats/filebeat/current/setup-repositories.html
- http://yongho1037.tistory.com/709
- http://dgkim5360.tistory.com/entry/managing-multiple-heterogeneous-inputs-on-filebeat-and-logstash
- http://blog.plura.io/?p=3363
- https://www.elastic.co/guide/en/beats/filebeat/current/configuration-filebeat-options.html#_literal_tags_literal
- https://github.com/logstash-plugins/logstash-patterns-core/blob/master/patterns/grok-patterns (grok 패턴 모음)
- https://grokdebug.herokuapp.com/ (grok 패턴 사용시 테스트)
- https://www.elastic.co/blog/geoip-in-the-elastic-stack (geoip 사용)
comments powered by Disqus
FEATURED TAGS
2024
3 keywords
accelerating team success
accesscontrol
adaptive growth
ai workload
alpine linux
ansible
ansible tower
apache2.4
architecture
argocd
asgi
aws
awx
backoffice
beautiful goodbye
begining docker
benchmark
blockhound
blocking code
blog
book
brew cask
build cache
collaboration
communication
composer
confluence
cronjob
curl
custom scheduler
customizing
customlog
data.sql
database
dependency management
developer
difference
docker
docker desktop
dockerize
dos attack
eks
elasticsearch
empty string
environment to do well
errorlogformat
event driven
experience
fast team
file upload
filebeat
fluentd
forwarded option
framework
fuse.js
golang
gpu workload
graceful deploy
happy new year
haproxy
haproxy 1.8
haproxy acl logging
haproxy custom variable logging
haproxy metric
haproxy reload fail
haproxy stat
heap memory
hedgehog sharp
how do i work
hugo
index alias
install
installation
instance type
inverted index
ioc
istio
iterm
java
jdk 21
jekyll
jekyll to hugo
jetbrains
json
k8s
k8s api
kmooc
kubernetes
leadership
learning in 2019
let's encrypt
letsencrypt
limit_req_zone
litestar
logstash
m1 macbook pro
macro
macro key mapping
mapping
match
match_phrase
maven
mentoring
microservice 설계 및 구현
migration
mm
multi datasource
mysql
nginx
nginx ingress
nginx regexp
ngram
node drain
null
openjdk
partial matching
phpstorm
poddisruptionbudget
poeaa
portfolio expansion
product strategy
python
python framework
query dsl
rate limit
rate litmiting
rds
reindex
resume feedback
rss template
seamless reload
search on hugo
service account & role
sidebar search
software engineer career
speed up
speedup
spring
spring boot
spring camp
spring camp 2023
spring event
ssh
struct
study
system manager
systemd reload
teamwork
template
term
throughput
timezone
tips
traffic management
ulid
unused plugins
uuid
ux consideration
virtual thread
vm options
webflux
wildcard
year review
zero downtime
만들면서 배우는 클린 아키텍처
시작하세요 도커
엔터프라이즈 애플리케이션 아키텍처 패턴
쿠버네티스 시작하기